The Urban Mobility Observatory (UMO) project will extensively collect data on mobility over a long period of time. UMO is a broad system of sensors and ICT infrastructure to observe mobility and travel behaviour and to combine data from different types of sensors. Different kinds of traffic, transport and mobility data will be collected, stored and made available for research on mobility and transport in urban regions. This is urgent, because understanding and managing the fast developments in the transportation field demand new observations.
The UMO sensor network (1) will contain instruments to monitor real life situations using for example camera’s, radars, LIDARs, BT/Wi-Fi trackers and mobile apps. Also, a moving sensor network consisting of vehicles and mobile equipment deliver additional observations. As a showcase for these sensors, we are setting up so-called hotspots in Alkmaar, Amsterdam, Delft, Groningen and Utrecht, where we apply these sensors and collect data for a long period of time.
Certain data about travel behaviour and travel preferences will be collected via crowdsourcing and social media (2). A panel, including participants from five Dutch urban areas (Amsterdam, Utrecht, Groningen, Delft and Alkmaar), will be followed throughout the years and changes in air travel behaviour will be followed over time and be explained from changes within their households or personal circumstances, spatial changes, policy measures, etc.
The virtual reality (VR) and augmented reality (AR) environments (3) aim to closely observe (individual)
human behaviour and experiences in specific experimental traffic conditions, such as potentially dangerous, not-yet existing, or rarely occurring situations. This could for example be a situation where pedestrians or cyclists interact with an autonomous vehicle or when they have to evacuate a building.
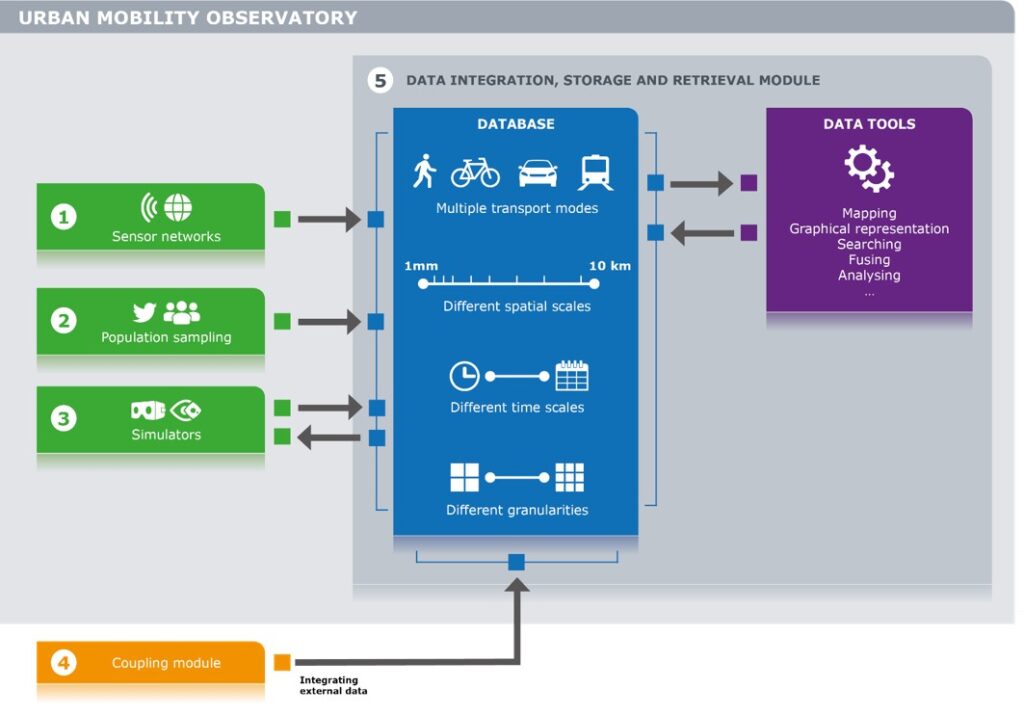
The Urban Mobility Observatory will functionally connect to existing data sources and living labs (4). This will, among others, enable a full integration of traffic and mobility behaviour on the one hand, and spatial data on for example land use, urban densities, land and real-estate prices, locational choice on the other. Mapping and graphical representation of data is another very important means for structuring data, analysing data and for conducting experiments. Therefore, the facility includes tools to represent data on maps (GIS), with virtual and with augmented reality settings.
The data gathered through the sensor networks, population sampling and simulators are all conveyed to a database (5), together with associated metadata and contextual information to keep the data retrievable and usable for a long period. The contextual data include data on weather conditions, traffic management measures, transport policies, roadworks, events and exceptional conditions as well as population statistics, land-use and urban densities, data on the spatial environment, and other potentially relevant contextual information. The data will be GDPR compliant, and when deemed necessary we work with DPIAs, forms of consent and user agreements. The latter is to ensure that the data are not used for other purpose than that were intended when collecting the data.